Mean, Median, Mode, Standard Deviation and Variance are the fundamental statistics concepts that are important for Python, Data Science and Machine Learning. Let’s break them down step by step:
📊 Key Statistical Terms
- Mean (Average)
- Formula: (Sum of values) ÷ (Number of values)
- Example: (2 + 3 + 7) / 3 = 4
- It tells us the “central” value.
- Median (Middle Value)
- Arrange data in order → pick the middle value.
- Example: [1, 3, 5] → Median = 3
- Example: [1, 3, 5, 7] → Median = (3 + 5) / 2 = 4
- Mode (Most Frequent Value)
- The number that occurs most often.
- Example: [2, 2, 3, 4] → Mode = 2
- Variance
- The average squared difference from the mean.
- High variance → data points are spread out.
- Low variance → data points are close to mean.
- Standard Deviation (SD)
- Square root of variance.
- A measure of spread/dispersion in the same units as data.
- Low SD → Data points close to mean (tight cluster).
- High SD → Data points spread widely.
📌 Intuitive Way to Remember
- Mean → Think “average class grade.”
- Median → Think “middle student in a queue.”
- Mode → Think “most popular ice-cream flavor.”
- Variance → Think “how far students’ grades differ from average.”
- Standard Deviation → Think “typical distance from average.”
📈 Graphical Understanding
Here’s what they look like visually:
- Mean → Center of gravity of distribution.
- Median → Splits data into two halves.
- Mode → Peak of the curve (highest frequency).
- Standard Deviation → Width of the curve (spread).
📈 Graphical Relationships
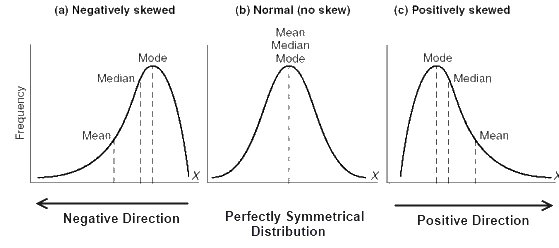
Symmetrical Distribution (Normal Distribution):
Mean, median, and mode are equal and located at the center of the distribution.
Skewed Distribution:
The mean, median, and mode differ. In a positively skewed distribution (tail to the right), the mean is greater than the median, which is greater than the mode. In a negatively skewed distribution (tail to the left), the mean is less than the median, which is less than the mode
Standard Deviation and Spread:
A larger standard deviation indicates a wider spread of data points around the mean.
NOTE: Measures of Central Tendency in Statistics – Central tendencies in statistics are numerical values that represent the middle or typical value of a dataset. Also known as averages, they provide a summary of the entire data, making it easier to understand the overall pattern or behavior. These values are useful because they capture the essence of large datasets in a single, representative number. The three most commonly used measures of central tendency are mean, median, and mode.